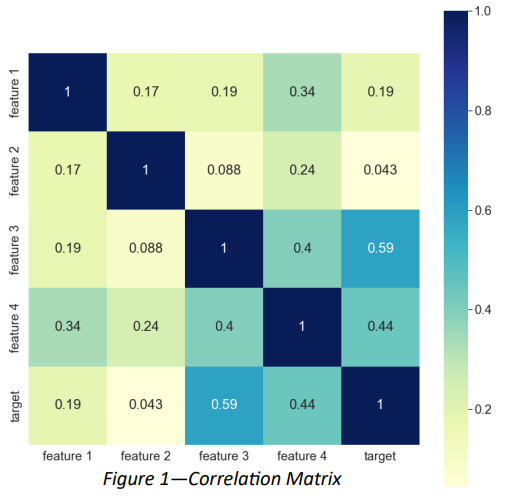
This helps us to initially determine which features correlate with other features or with the target variable. This visualization allows us to make initial conclusions as to which features are likely to have the most output on the model’s predictions. If two features are highly correlated, we may want to drop one of these.
ML Model Development
With the experience and expertise we have at hand, we maintain a structured and repeatable process for every machine learning problem. This helps us to deliver the best possible results in the least amount of time.

Initial Communication
Client communication is one of our top priorities, so we ensure all stakeholders are in the loop every step of the way.
An initial discussion establishes the project needs and gives us an opportunity to explore any available data.
This also allows us to consider the technologies that can be used, and discuss possible options and routes to arrive at the intended solution.
We then produce a project plan consisting of well-defined targets, steps to achieve those targets, and an estimated project duration. After getting approval, we begin the developmental stages of the project.
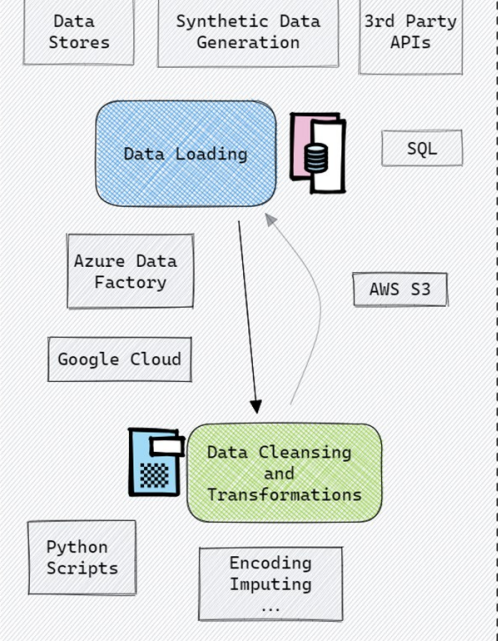
Data Loading
We support data loading and extraction from many sources and, if required, we can assist with data generation.
Our machine learning team is experienced in cloud platforms such as Microsoft Azure and Amazon Web Services, and regularly use SQL.
The data used for our machine learning projects is often loaded from cloud storage, where it is easily accessible and reusable. We store data in the most efficient way to optimize data loading and data storage.
Data Cleansing and Transformations
We also undertake data cleansing and restructuring to transform the data in preparation for training. This allows us to determine any inconsistencies in the data, such as features with missing or incorrect data, for which we can provide a solution.
During this step we can merge any separate datasets into one, ready for training.
If required, we will also encode certain features or impute missing values.
These processing steps prepare the data in a repeatable way, so that any new data can be processed in the same fashion.
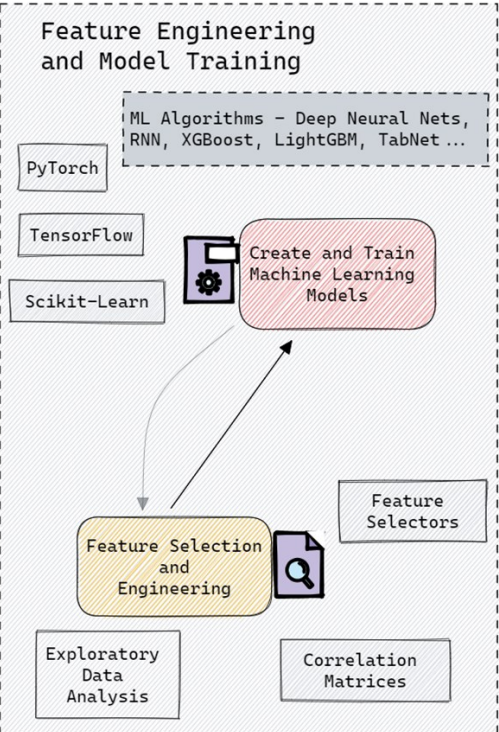
Feature Selection and Engineering
For feature selection and engineering we use several tools and visualizations.
As an initial data analysis tool we may use correlation matrices - these help us to determine any features that are highly correlated with the target variable and any features that have low correlation, and are therefore not likely to affect model output.
Feature selectors are another tool used to determine which features are likely to be most significant to the model’s output.
Feature selection decisions will extend to discussions with our client, where, if required, we can look at possible new features that can be added from the current data, or any alternative data sources that could be valuable.
Create and Train Machine Learning Models
For building machine learning models we use multiple frameworks including PyTorch, TensorFlow and Scikit-Learn.
We first experiment by training using a selection of algorithms that we think are best suited for the problem, these may include: decision tree-based methods (such as random forests and XGBoost), ensembles and deep neural networks.
Using multiple algorithms allows us to view the project from a few different angles, and then determine which is the best route to take.
When required, we will optimize and fine-tune the hyperparameters of each model to improve the overall performance.
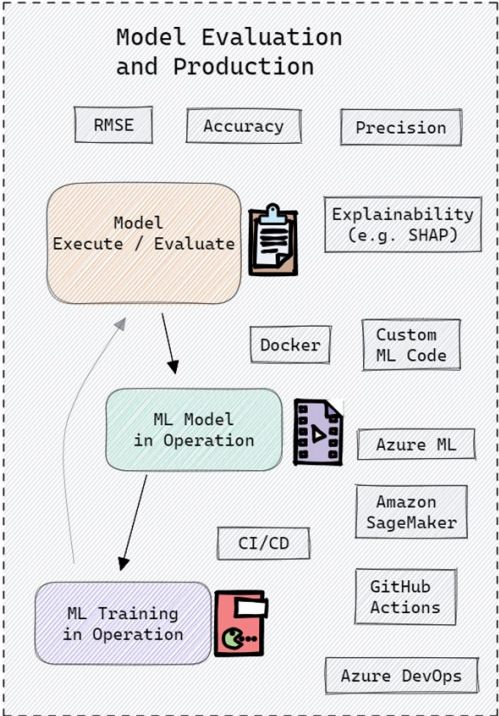
Model Evaluation
Once we have trained the models, we begin evaluating model performance to judge which is best suited for the data.
For this, we consider several metrics for comparison such as accuracy and precision in the case of classification tasks, or RMSE and MAE for regression tasks.
We also explain the machine learning model by plotting a model explainer such as SHAP. This tells us which features had the most and least impact on model output, which we compare against the results of our feature selection process.
If the results are not sufficient, we may look to collect more data, add new features, use ensembling or retune hyperparameters.
Productionizing Model
Once the best model or models have been determined, we then move them into production.
We can provide a real-time inferencing service, or set up an automated process, that can extract and process data, predict, and store the results in a data store.
If necessary, we will also productionize the model training steps, such that when new data is available, models are automatically retrained and updated.
If suitable, we will use CI/CD tools such as Azure DevOps or GitHub Actions throughout the project to automate deployment into our client’s environment.
Once in production, we are on hand to monitor and optimize the service if required.
We use a multitude of tools and visualizations to assist with the developmental stages of our projects.
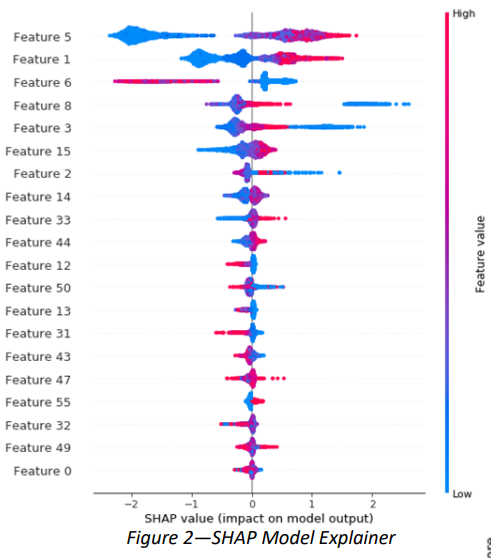
This explains to us how the model is making its predictions. From this plot, we can determine which features are most and least significant to the model’s output and can ascertain which direction the prediction is moved by higher or lower values of each feature.
Model Explainer - SHAP
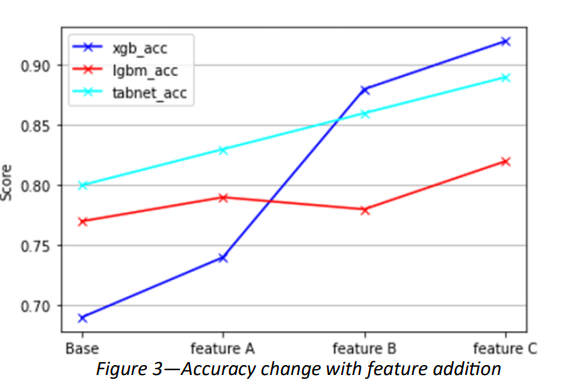
This indicates whether a model’s predictions are improving with the addition of each new feature. Similar plots can be used to examine F1 scores, RMSE or MAE.
Plot of Accuracy with Addition of New Features
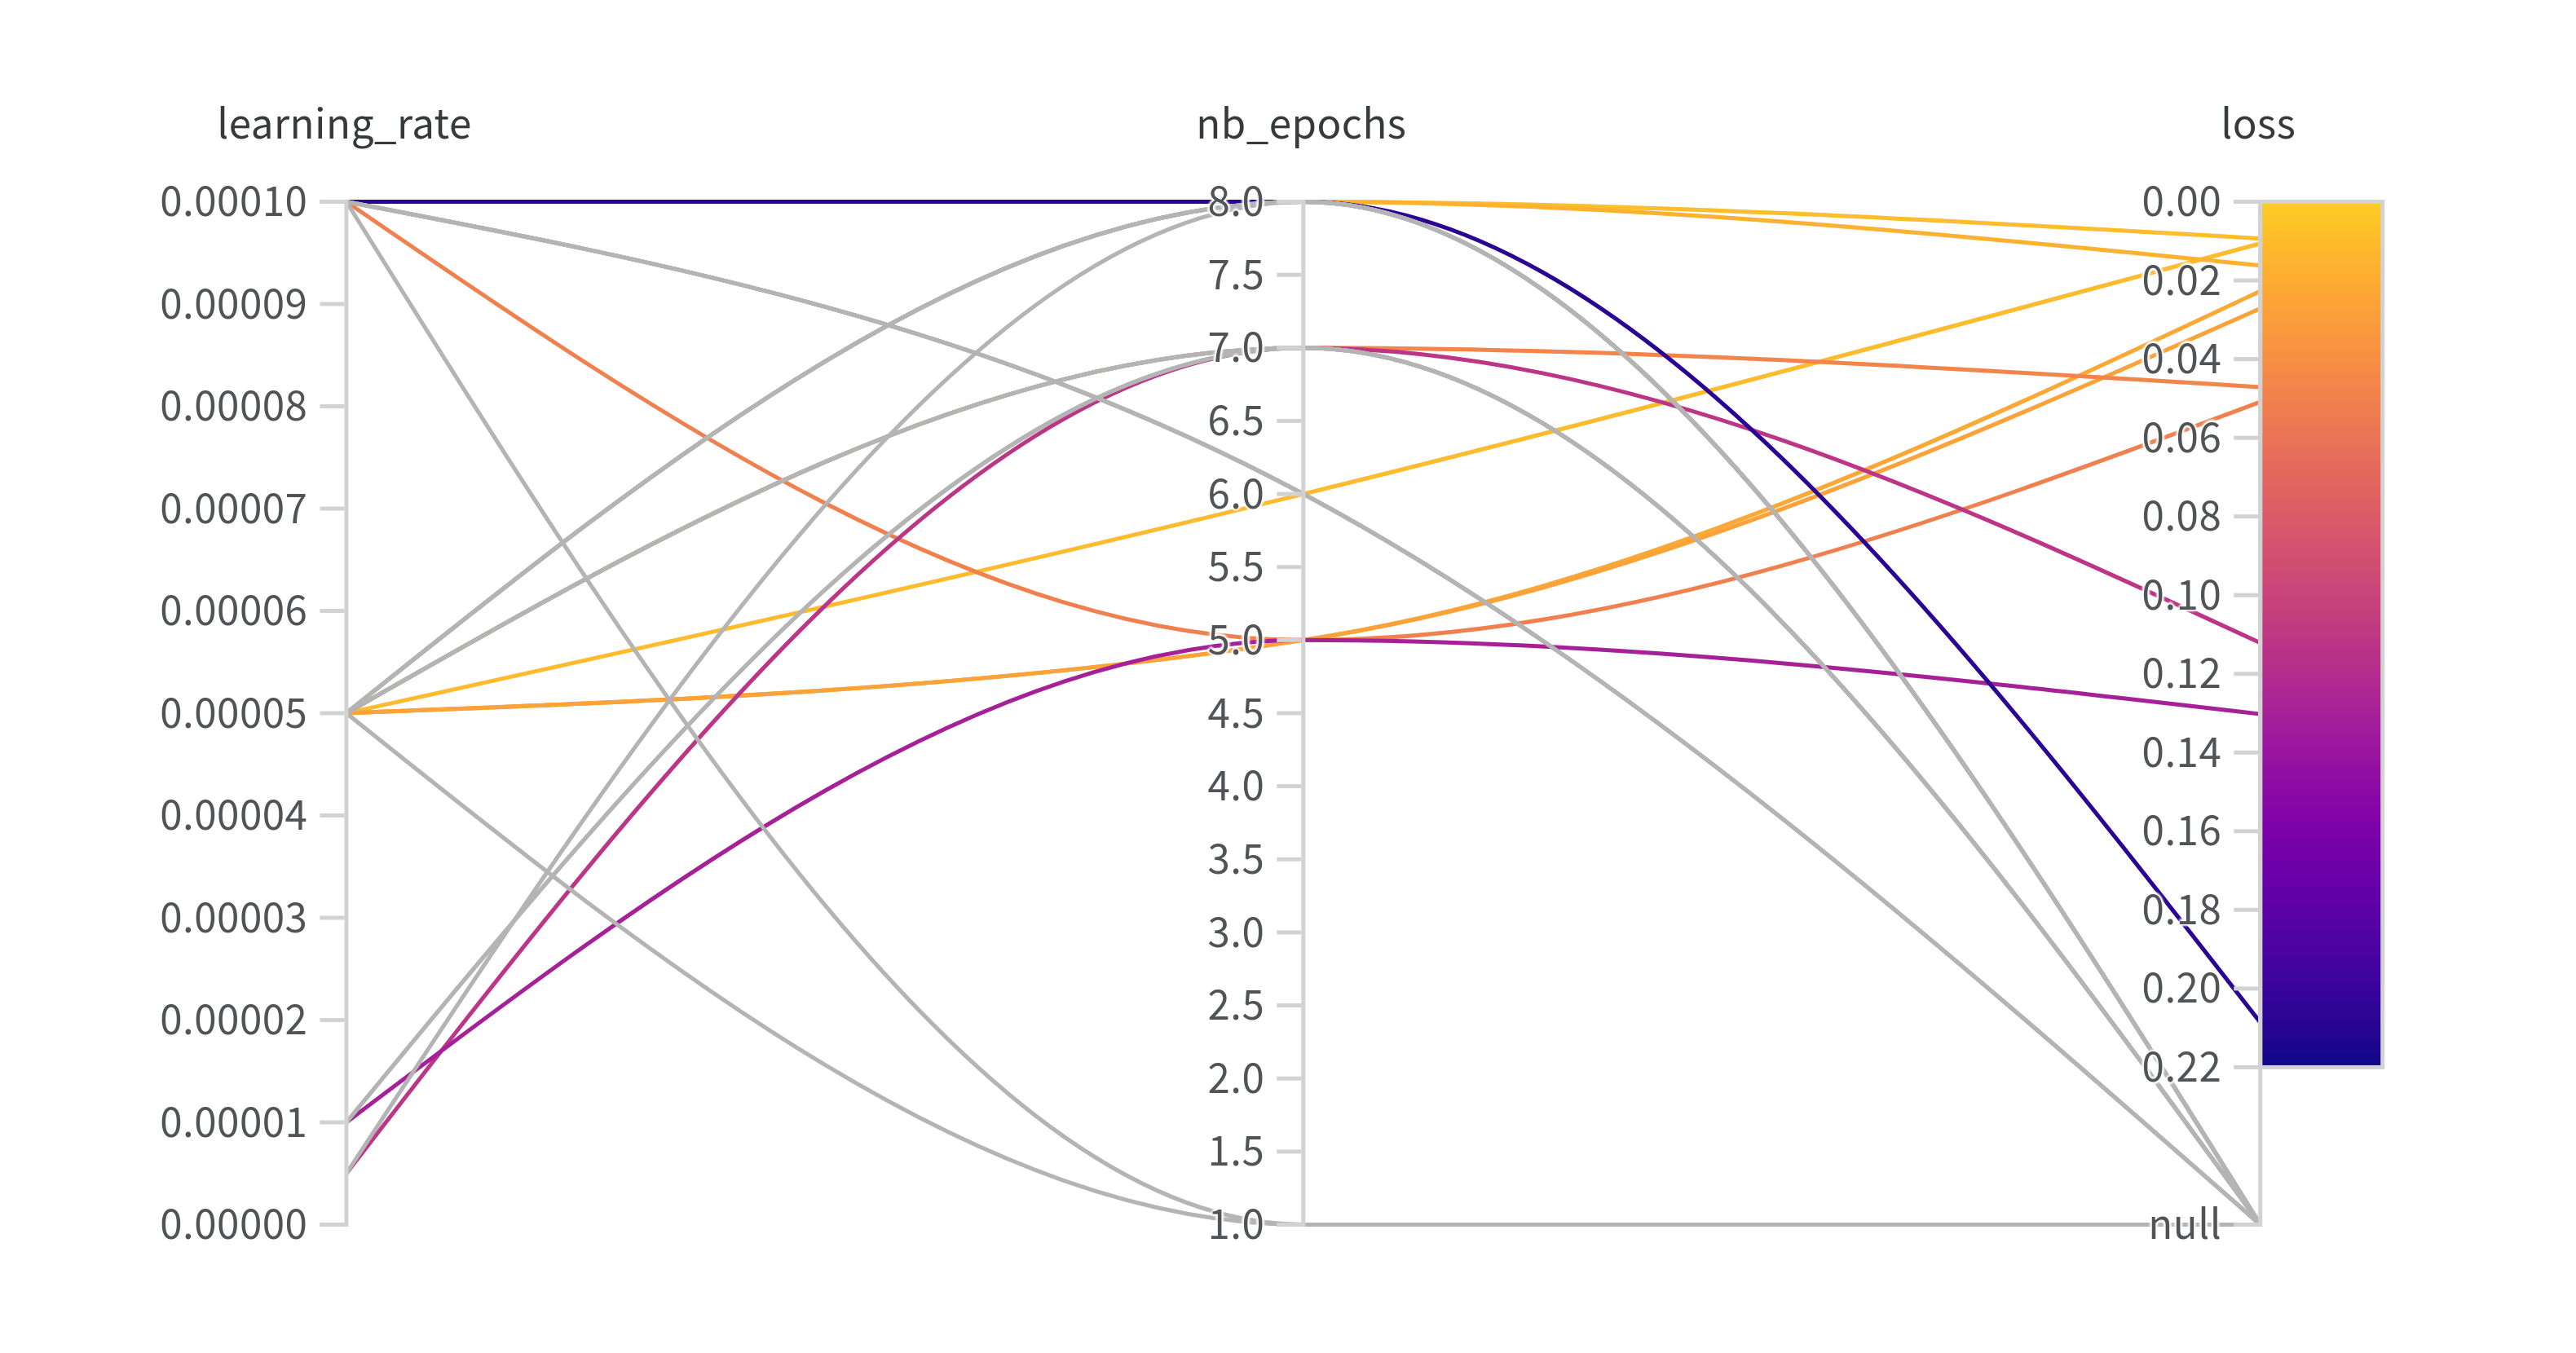
This gives an overview of the hyperparameter tuning process. The values of each parameter can be directly compared to their respective effect on the performance of the model. This allows us to pick the best choice of hyperparameters.
Parallel Coordinates Plot
Contact
© 2023 Oscore loves ML